You’ve built 6 microservices. They compile, they pass tests, they run fine from your IDE. Now try handing them to someone else and asking them to run the whole thing.
Different JDK version? Broken. Different OS? Broken. Missing environment variable? Broken. And even if everything somehow works, good luck asking someone to manually spin up 6 Spring Boot apps, a PostgreSQL database, a RabbitMQ broker, and a Keycloak server, all in the right order.
So how do you go from “it works on my machine” to something anyone can run, anywhere? Three steps:
- Packaging: turning Java code into container images with Jib
- Orchestrating: running and managing everything in a Kubernetes cluster
- Automating: deploying the whole stack with a single Skaffold command
Stage 1: Packaging (from Java code to container image)
The traditional way (and why we skipped it)
Normally you’d write a Dockerfile, install a JDK, copy a JAR, configure layers. It works, but it’s boilerplate-heavy and the images end up bigger than they need to be.
We went with Jib instead.
What Jib does
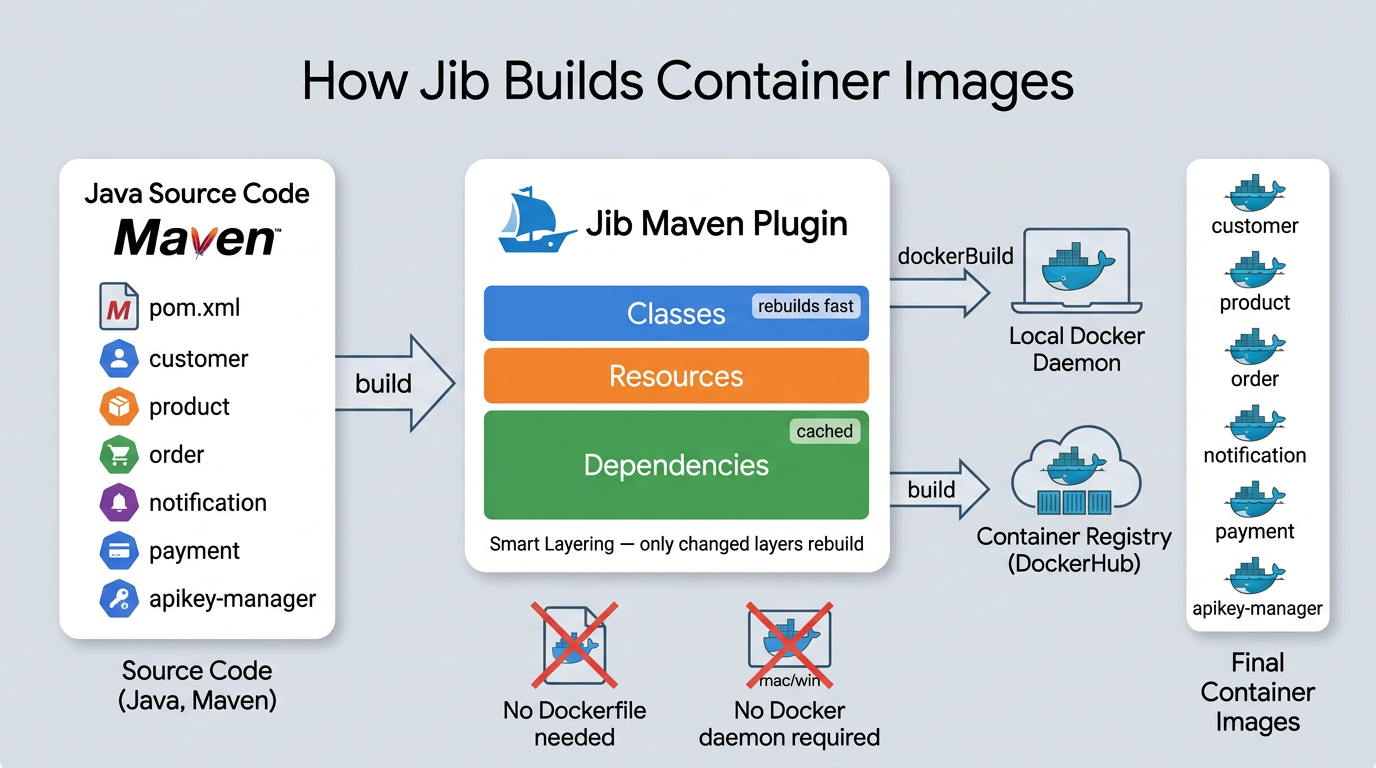
Jib is a Maven plugin from Google that builds optimized container images straight from your Maven project. No Dockerfile to write, no Docker daemon required on your machine.
What makes it really useful:
- It talks to registries directly. You can build and push images without a running Docker daemon on your machine.
- Smart layering. Instead of one fat JAR layer, Jib splits your app into dependencies, resources, and classes. Change one line of code? Only the classes layer rebuilds. Dependencies stay cached.
- Reproducible builds. Same source = same image, every time.
How we set it up
In the parent pom.xml, we define Jib once in pluginManagement:
<pluginManagement>
    <plugins>
        <plugin>
            <groupId>com.google.cloud.tools</groupId>
            <artifactId>jib-maven-plugin</artifactId>
            <version>${jib.maven.plugin.version}</version>
            <configuration>
                <from>
                    <image>eclipse-temurin:21-jre</image>
                </from>
                <to>
                    <image>${image}</image>
                </to>
            </configuration>
        </plugin>
    </plugins>
</pluginManagement>
${image} resolves to miliariadnane/${project.artifactId}. So the Product service becomes miliariadnane/product, Customer becomes miliariadnane/customer, etc. The base image is eclipse-temurin:21-jre, a lightweight Java 21 runtime since we don’t need the full JDK in production.
Each microservice just declares the plugin in its own pom.xml:
<plugin>
    <groupId>com.google.cloud.tools</groupId>
    <artifactId>jib-maven-plugin</artifactId>
</plugin>
Zero Dockerfiles in the entire project.
Building images
Each microservice defines two Maven profiles for building images. The difference between them comes down to one thing: the Jib goal.
The local profile uses the dockerBuild goal. This builds the image and loads it straight into your local Docker daemon, which is what you want when developing on your machine:
<profile>
    <id>jib-build-push-image-to-local</id>
    <build>
        <plugins>
            <plugin>
                <groupId>com.google.cloud.tools</groupId>
                <artifactId>jib-maven-plugin</artifactId>
                <version>${jib.maven.plugin.version}</version>
                <configuration>
                    <from>
                        <image>eclipse-temurin:21-jre</image>
                    </from>
                    <to>
                        <image>${image}</image>
                        <tags>
                            <tag>latest</tag>
                        </tags>
                    </to>
                </configuration>
                <executions>
                    <execution>
                        <phase>package</phase>
                        <goals>
                            <goal>dockerBuild</goal>
                        </goals>
                    </execution>
                </executions>
            </plugin>
        </plugins>
    </build>
</profile>
The DockerHub profile uses the build goal instead. This one pushes the image directly to the registry without needing a local Docker daemon at all:
<profile>
    <id>jib-build-push-image-to-dockerhub</id>
    <build>
        <plugins>
            <plugin>
                <groupId>com.google.cloud.tools</groupId>
                <artifactId>jib-maven-plugin</artifactId>
                <version>${jib.maven.plugin.version}</version>
                <configuration>
                    <from>
                        <image>eclipse-temurin:21-jre</image>
                    </from>
                    <to>
                        <image>${image}</image>
                        <tags>
                            <tag>${image.custom.tag}</tag>
                            <tag>latest</tag>
                        </tags>
                    </to>
                </configuration>
                <executions>
                    <execution>
                        <phase>package</phase>
                        <goals>
                            <goal>build</goal>
                        </goals>
                    </execution>
                </executions>
            </plugin>
        </plugins>
    </build>
</profile>
To run either one:
# Build to local Docker daemon (for local dev)
mvn clean install -P jib-build-push-image-to-local -Dspring.profiles.active=docker -DskipTests

# Push to Docker Hub (for remote deployments / CI)
mvn clean install -P jib-build-push-image-to-dockerhub -Dspring.profiles.active=docker -DskipTests
But when we deploy with Skaffold (Stage 3), we don’t run these manually. Skaffold calls Jib directly, watches for changes, and rebuilds only what’s needed.
For a deeper dive into Jib and containerization, check out: Speed Up Your Java App Image Build Using Jib and Dockerizing Spring Boot App with Jib.
Stage 2: Orchestrating (running everything in a cluster)
At this point we have container images for all our services. In the previous parts, we ran everything locally using Docker Compose, and that works perfectly fine for development. One docker-compose up -d and all your services, PostgreSQL, RabbitMQ, Keycloak, everything starts on your machine.
But Docker Compose is a single-machine tool. It doesn’t know how to spread containers across multiple servers, restart a crashed service automatically, scale a service from 1 to 5 instances based on load, or roll out a new version without downtime. When you move to production (deploying to AWS with EKS, for example), you need something built for that.
That’s where Kubernetes comes in.
So what is Kubernetes?
Kubernetes (K8s) is a container orchestration platform originally built by Google. The idea is straightforward: you describe what you want running (which containers, how many copies, what config) and Kubernetes figures out how to make it happen. If a container crashes, K8s restarts it. Need three copies of a service? K8s schedules them across available machines and balances traffic between them.
The cluster
A K8s cluster has two parts:
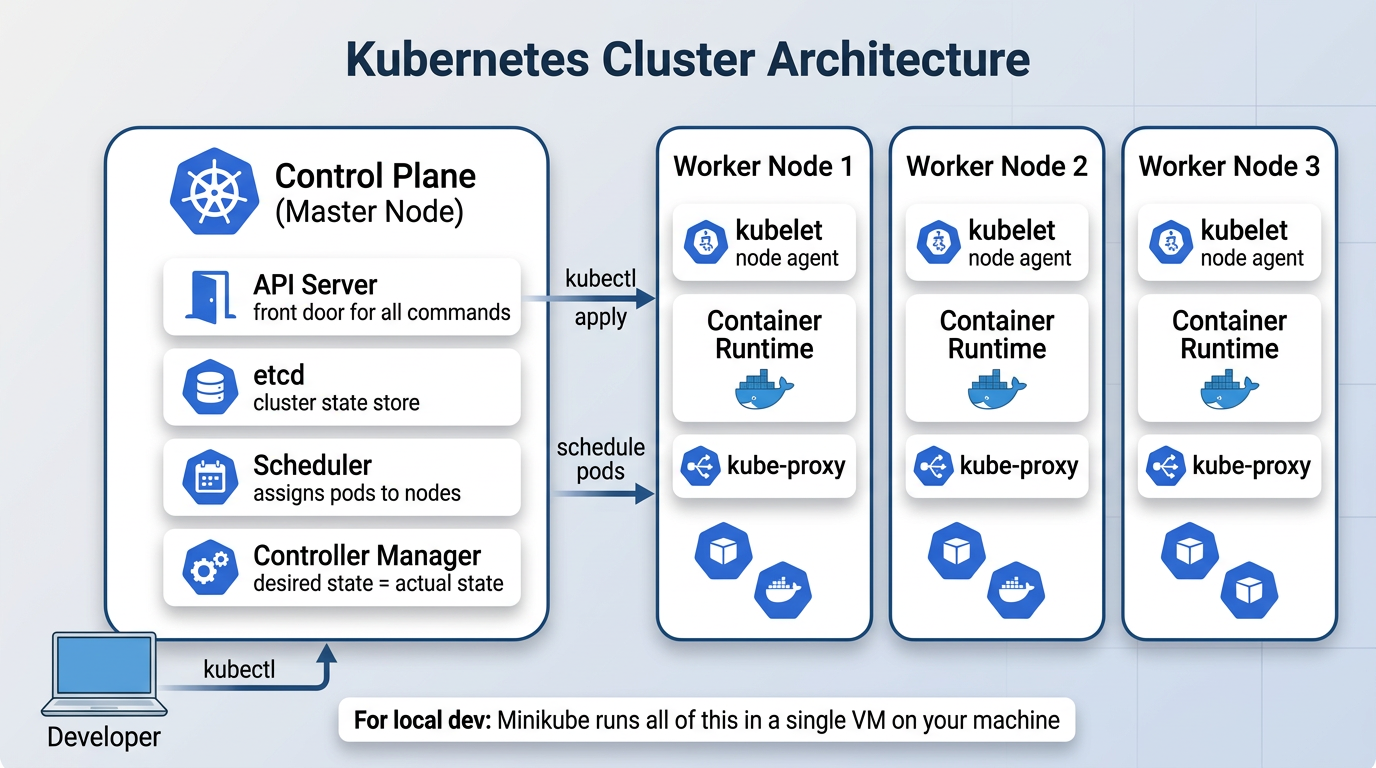
The control plane is the brain. It runs the API server (the front door for all commands), etcd (where cluster state is stored), the scheduler (decides which node runs which pod), and the controller manager (constantly checks that what’s running matches what you asked for).
The worker nodes are where your containers actually run. Each node has a kubelet (an agent that talks to the control plane), a container runtime (like Docker or containerd), and kube-proxy (handles networking between pods).
For local development, we use Minikube, which runs the entire cluster inside a single VM on your machine. The nice part is that the same manifest files you write for Minikube work on a real cloud cluster like AWS EKS without changes.
K8s building blocks
Before looking at our manifests, here’s a quick overview of the K8s objects we use in this project:
| Object | What it does |
|---|---|
| Pod | The smallest unit you can deploy. Wraps one or more containers. You rarely create pods directly. |
| Deployment | Manages pods: creates them, keeps the right number running, handles rolling updates. |
| StatefulSet | Like a Deployment, but for stateful things like databases. Pods get stable names and persistent storage. |
| Service | Gives pods a stable DNS name and IP. Other pods use this name instead of tracking pod IPs. |
| ConfigMap | Stores non-sensitive config (DB host, init scripts) outside your container image. |
| Secret | Same idea as ConfigMap, but for sensitive data (passwords, tokens). Values are base64-encoded. |
| PersistentVolume | Disk storage that survives pod restarts. Used for databases so data isn’t lost when a pod dies. |
| Ingress | Routes external HTTP traffic to the right service based on URL paths. |
All of these show up in our project. Let’s walk through the important ones.
What we deploy
Our K8s manifests live under k8s/minikube/, split into two groups:
| Group | Path | Contents |
|---|---|---|
| Infrastructure | k8s/minikube/bootstrap/ | PostgreSQL, RabbitMQ, Jaeger, Keycloak, Prometheus, Grafana, Ingress |
| Services | k8s/minikube/services/ | Customer, Product, Order, Notification, Payment, ApiKey-Manager |
Infrastructure goes up first. Services depend on it.
Deployments: how a service runs
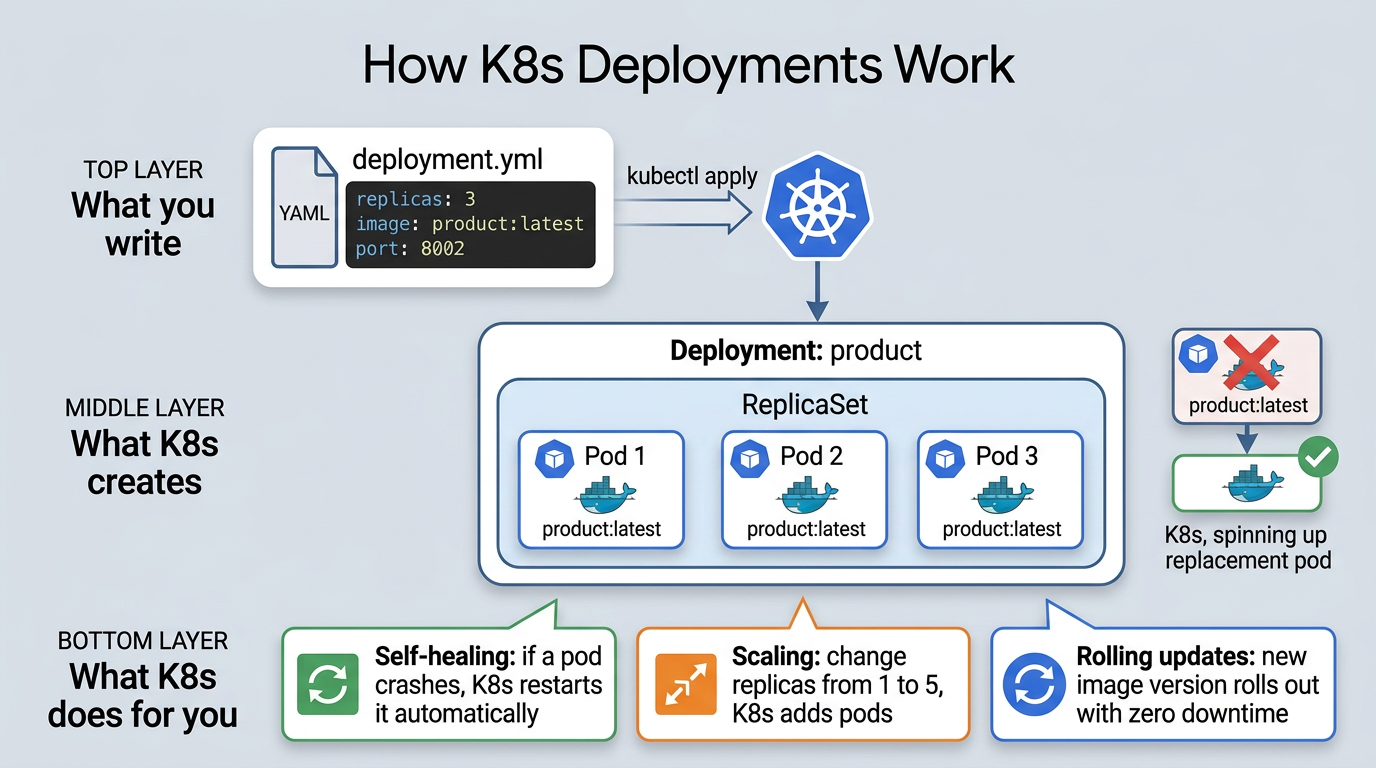
A Deployment tells K8s: “run this container image with these settings, and keep N replicas alive.”
Here’s the Product service deployment:
apiVersion: apps/v1
kind: Deployment
metadata:
  name: product
spec:
  replicas: 1
  selector:
    matchLabels:
      app: product
  template:
    metadata:
      labels:
        app: product
    spec:
      containers:
        - name: product
          image: miliariadnane/product:latest
          imagePullPolicy: IfNotPresent
          ports:
            - containerPort: 8002
          env:
            - name: SPRING_PROFILES_ACTIVE
              value: kube
            - name: DB_USERNAME
              valueFrom:
                secretKeyRef:
                  name: postgres-secret
                  key: DB_USERNAME
            - name: DB_PASSWORD
              valueFrom:
                secretKeyRef:
                  name: postgres-secret
                  key: DB_PASSWORD
A few things worth noting here:
image: miliariadnane/product:latestis the image Jib builds for us in Stage 1imagePullPolicy: IfNotPresenttells K8s to use the local image instead of pulling from a remote registrySPRING_PROFILES_ACTIVE: kubeactivates the Kubernetes Spring profile (more on this below)- DB credentials come from a Secret called
postgres-secret, not hardcoded in the manifest
K8s has two objects for externalizing config: Secrets for sensitive data (passwords, tokens) and ConfigMaps for everything else (database hostnames, init scripts). In our project, PostgreSQL uses both: a Secret for credentials and a ConfigMap with an init script that auto-creates all 7 databases on first startup. This keeps config out of your container images and makes it easy to change per environment.
How the kube Spring profile ties it all together
This is where the Spring Boot world meets the Kubernetes world. When SPRING_PROFILES_ACTIVE is set to kube, each microservice loads a shared config file (shared-application-kube.yml):
spring:
  datasource:
    url: jdbc:postgresql://postgres:5432/${spring.application.name}
    username: ${DB_USERNAME}
    password: ${DB_PASSWORD}
  rabbitmq:
    addresses: rabbitmq:5672
  security:
    oauth2:
      resourceserver:
        jwt:
          issuer-uri: http://keycloak:8080/realms/demo-realm

eureka:
  client:
    enabled: false
Look at the hostnames: postgres, rabbitmq, keycloak. These aren’t hardcoded IPs. They’re K8s Service names. Kubernetes DNS resolves postgres to whatever pod is running PostgreSQL at that moment. Same for RabbitMQ and Keycloak.
And notice eureka.client.enabled: false. In Docker Compose (parts 02 to 04), we used Eureka for service discovery. In Kubernetes, we don’t need it anymore because K8s DNS handles that natively. Every Service gets a DNS name, and pods just use those names to find each other.
Services: how pods find each other
Pods are temporary. They restart, move between nodes, and get new IPs every time. You can’t hardcode a pod’s IP address and expect it to work tomorrow.
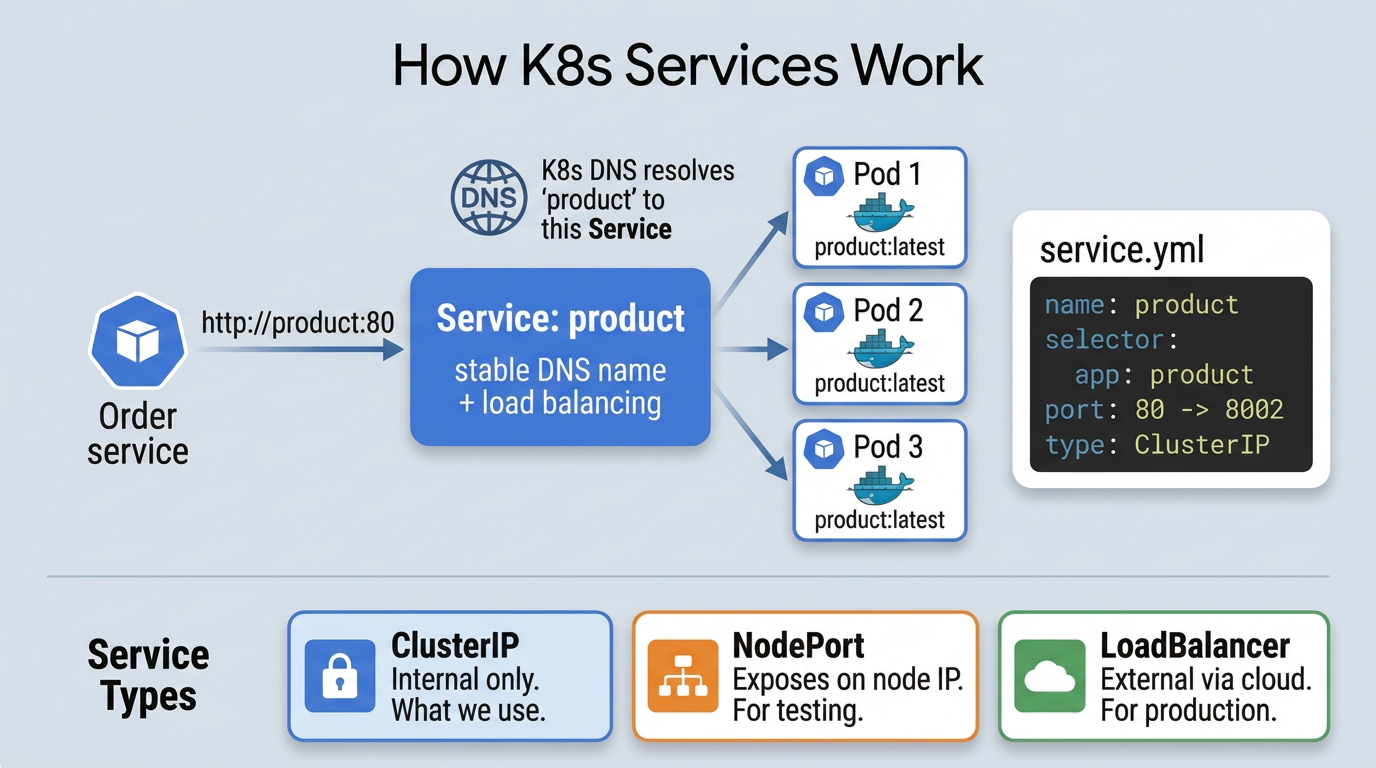
A Service gives pods a stable DNS name. Other pods talk to the Service name, and K8s routes traffic to whichever pod is healthy behind it.
apiVersion: v1
kind: Service
metadata:
  name: product
spec:
  selector:
    app: product
  ports:
    - port: 80
      targetPort: 8002
  type: ClusterIP
ClusterIP means this service is only reachable inside the cluster. When the Order service calls http://product:80, K8s resolves that name through DNS and routes the request to the Product pod. That’s exactly what the kube Spring profile is set up to do.
K8s supports other Service types too: NodePort exposes a service on a static port on every node (useful for testing), and LoadBalancer provisions an external load balancer from your cloud provider (useful in production). But for internal service-to-service communication, ClusterIP is what we use.
For routing external traffic into the cluster (from your browser or Postman), we use an Ingress. It maps URL paths like
/api/v1/productto the right Service. You can find the Ingress manifest ink8s/minikube/bootstrap/ingress/.
Stage 3: Automating (one command to deploy everything)
We have images (Jib) and K8s manifests. But deploying manually means: build 6 services, create images, apply infrastructure manifests, apply service manifests, check pods, tail logs. Do that for every code change and you’ll burn more time deploying than coding.
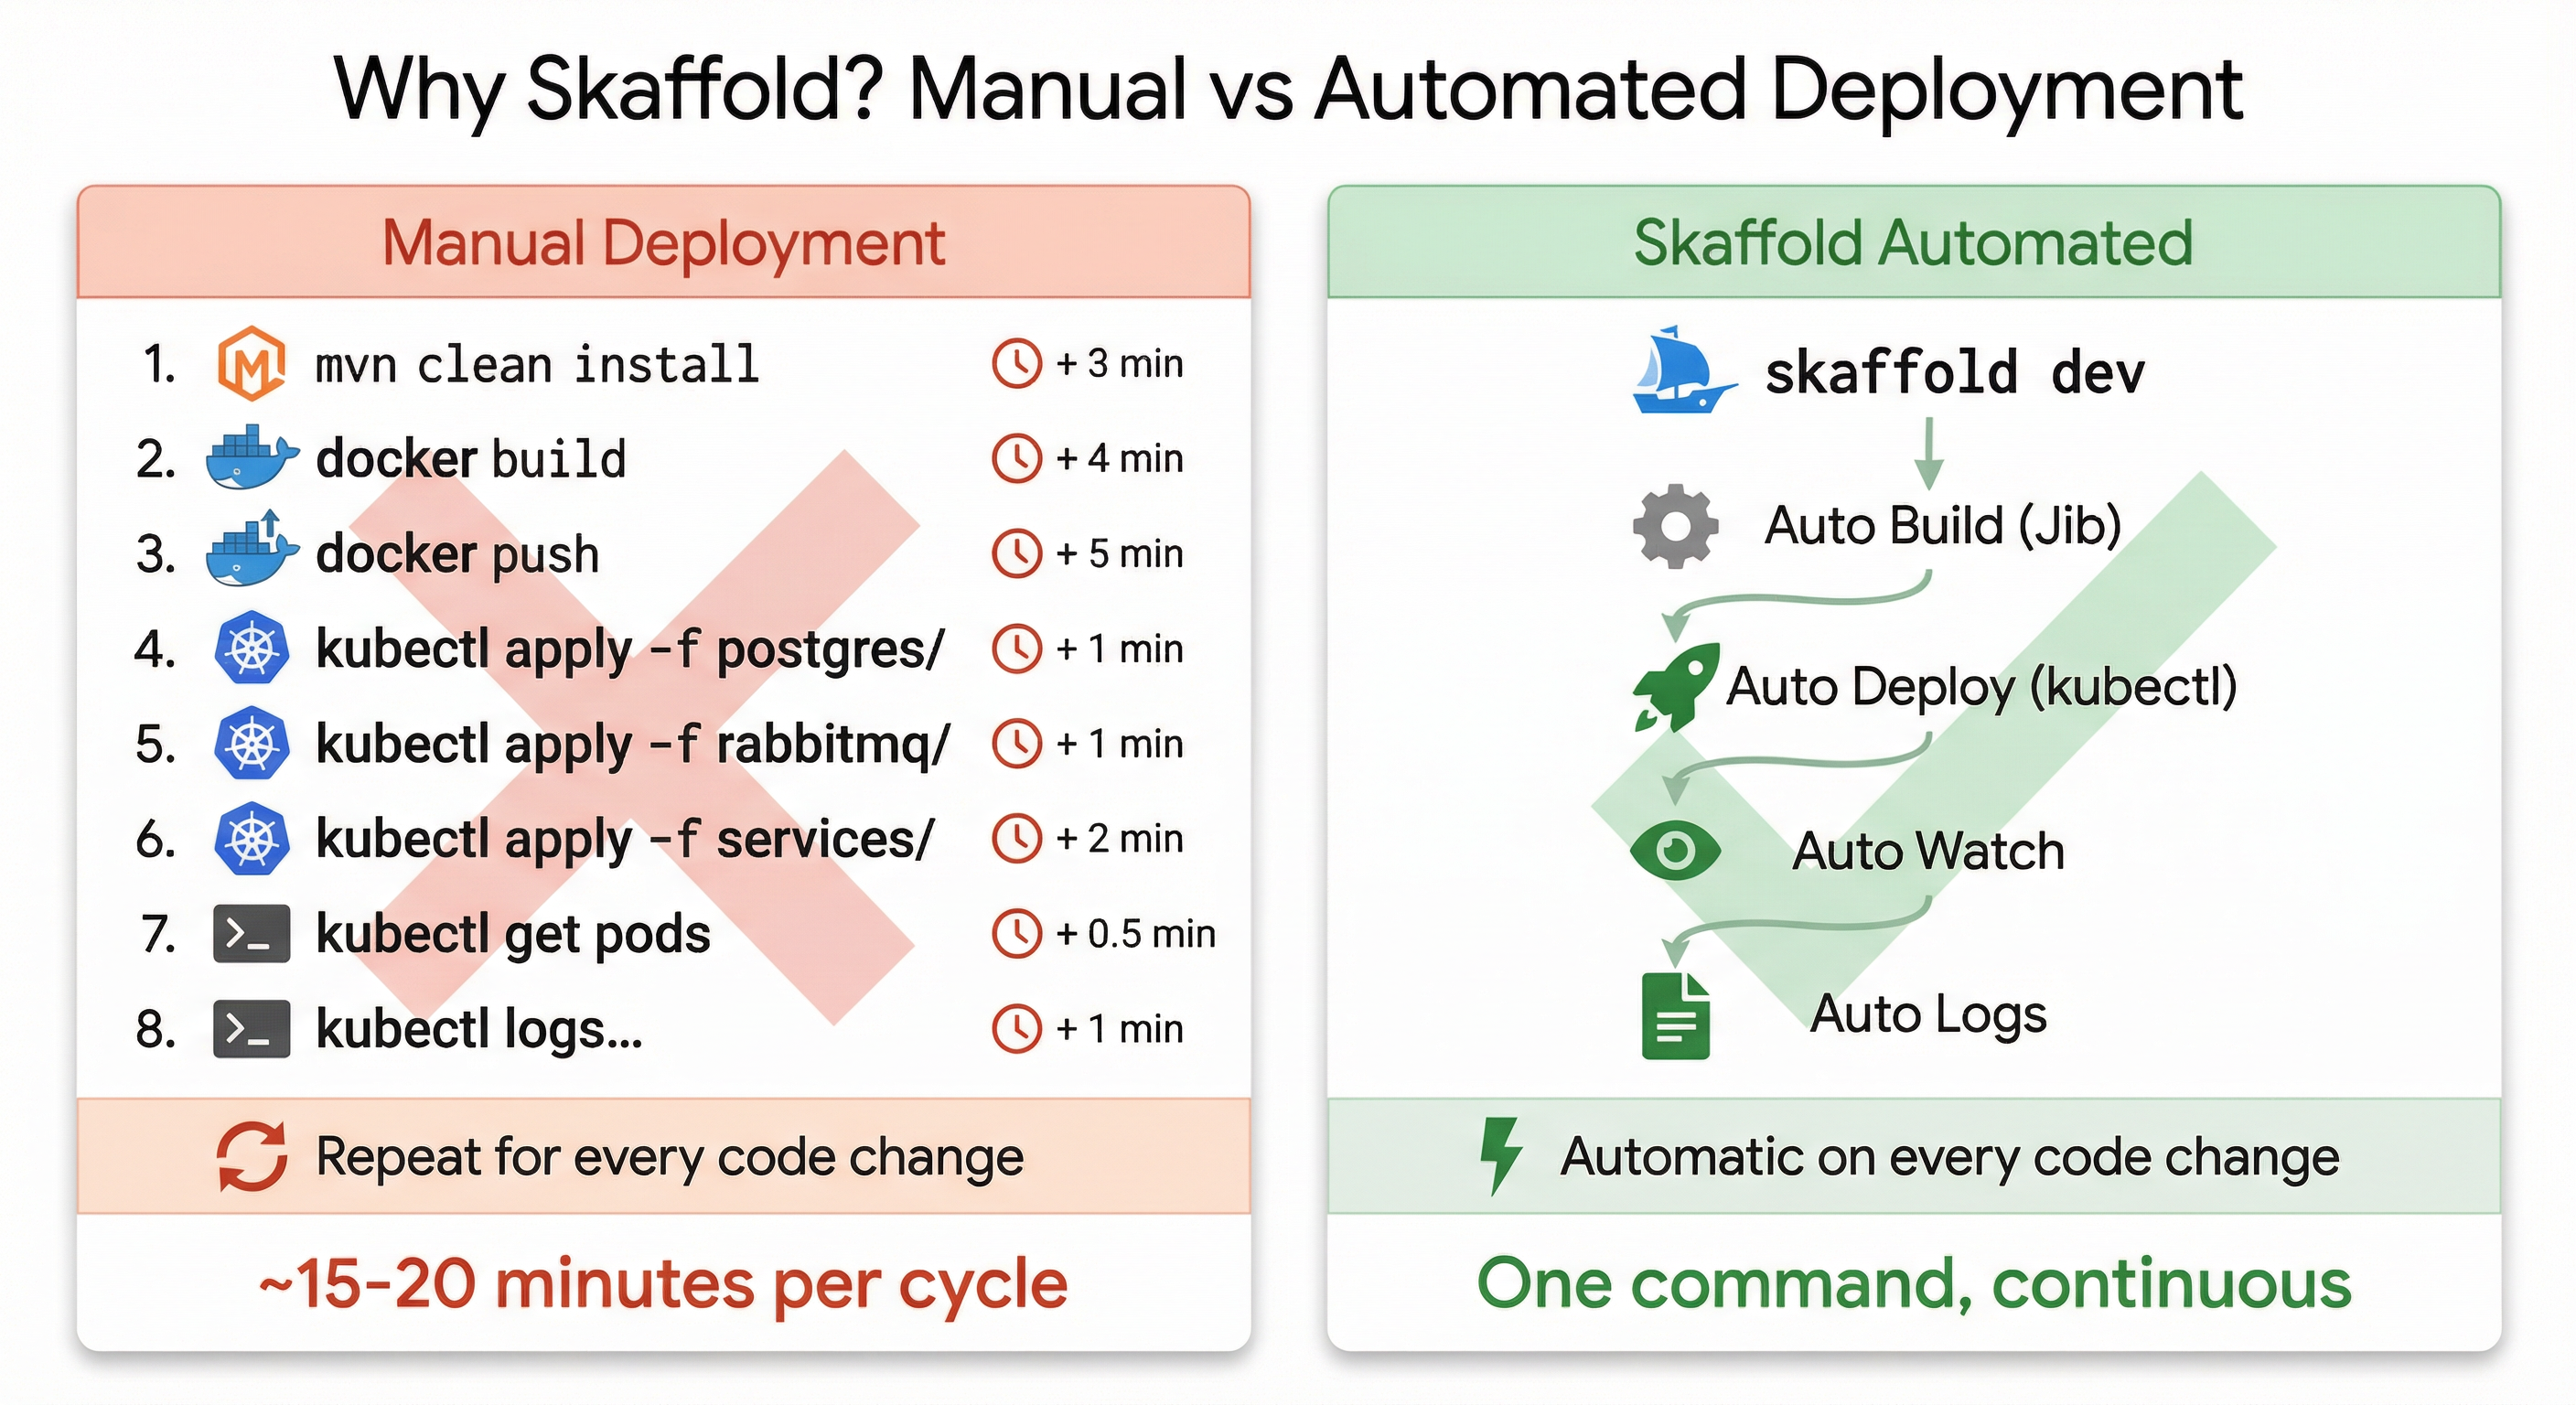
So what is Skaffold?
Skaffold is a CLI tool from Google that automates the build-push-deploy cycle for Kubernetes. Run skaffold dev and it builds images with Jib, applies manifests, watches for code changes, rebuilds only what changed, and streams all logs to your terminal.
Unlike CI/CD tools like Jenkins or GitHub Actions that run on remote servers, Skaffold runs locally on your machine. It’s built for the quick code-build-test loop you need during development.
The dev loop
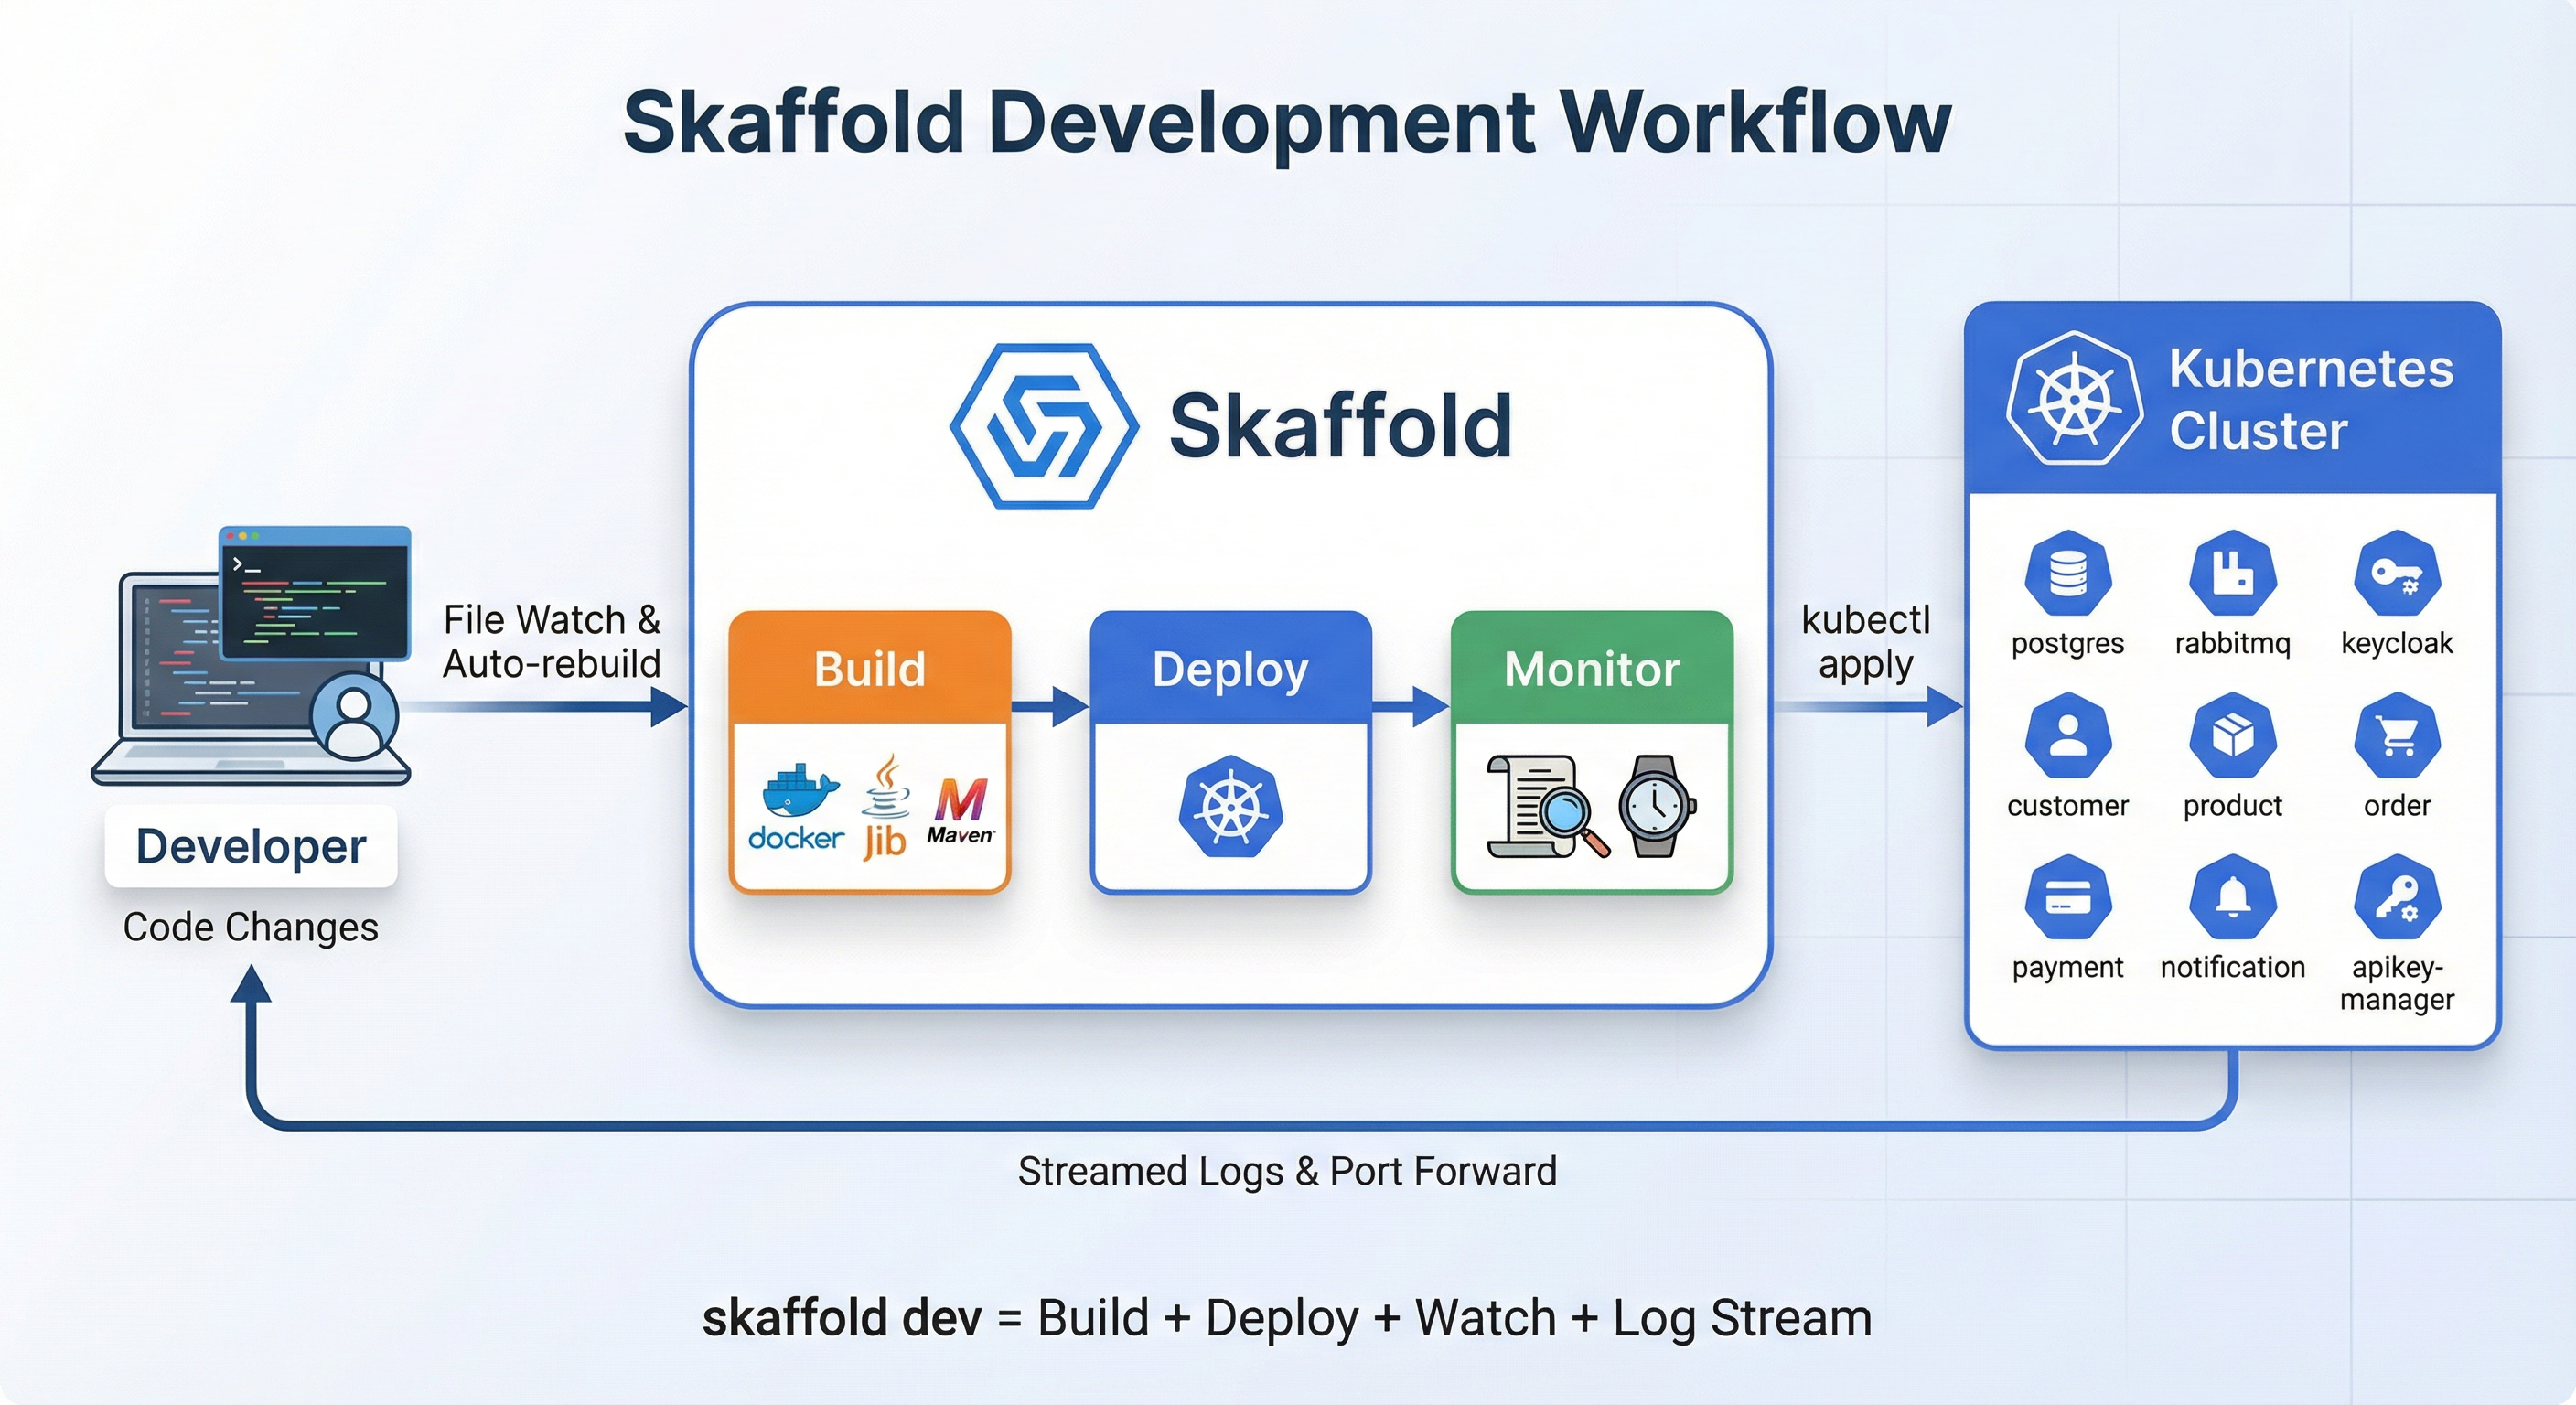
When you run skaffold dev:
- Watch: monitors your source files
- Build: detects a change, rebuilds only that service using Jib
- Deploy: applies K8s manifests via
kubectl - Stream: pipes logs from all pods to your terminal
- Repeat: loops until you hit
Ctrl+C, which cleans up everything it deployed
Inside skaffold.yaml
Everything is in one file at the project root. It has four sections:
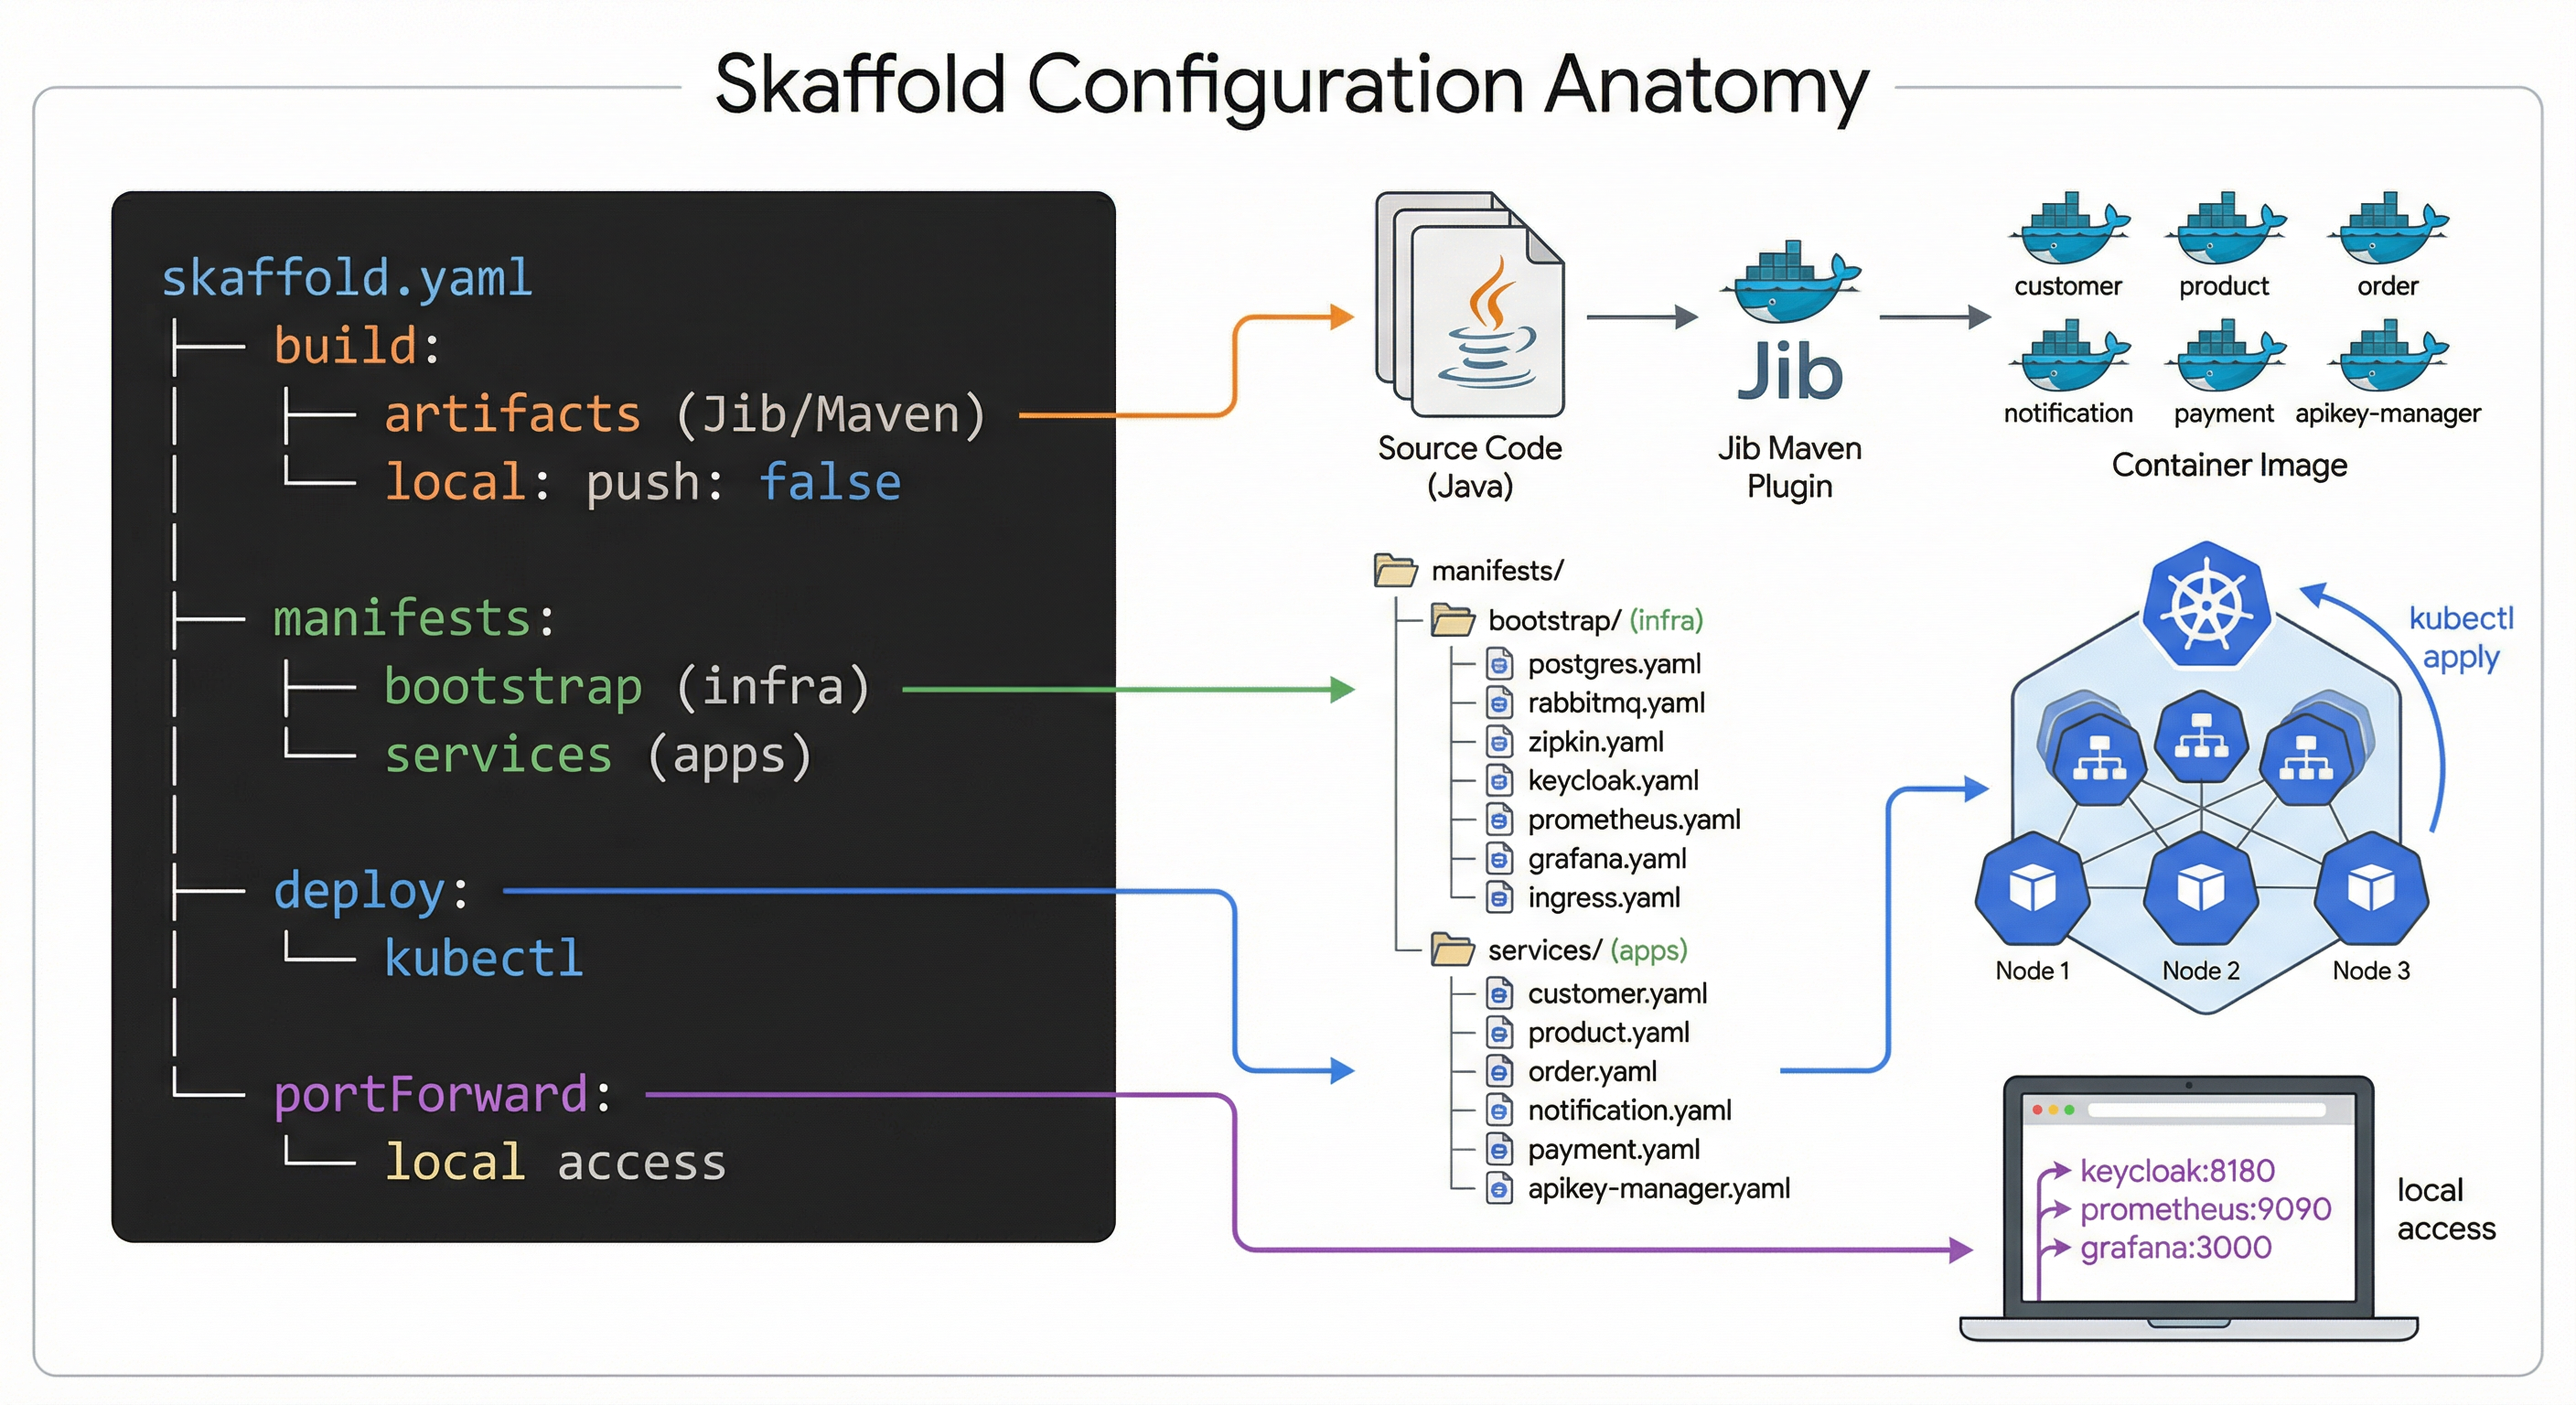
1. Build (how images are created):
build:
  local:
    push: false
  artifacts:
    - image: miliariadnane/customer
      jib:
        type: maven
        project: customer
        args:
          - "-Dspring.profiles.active=kube"
    - image: miliariadnane/product
      jib:
        type: maven
        project: product
        args:
          - "-Dspring.profiles.active=kube"
    # ... same for order, notification, payment, apikey-manager
push: false keeps images in Minikube’s Docker daemon. Each artifact maps to a Maven module and uses Jib.
2. Manifests (which K8s files to apply):
manifests:
  rawYaml:
    - k8s/minikube/bootstrap/postgres/*.yml
    - k8s/minikube/bootstrap/rabbitmq/*.yml
    - k8s/minikube/bootstrap/jaeger/*.yml
    - k8s/minikube/bootstrap/keycloak/*.yml
    - k8s/minikube/bootstrap/prometheus/*.yml
    - k8s/minikube/bootstrap/grafana/*.yml
    - k8s/minikube/bootstrap/ingress/*.yml
    - k8s/minikube/services/customer/*.yml
    - k8s/minikube/services/product/*.yml
    - k8s/minikube/services/order/*.yml
    - k8s/minikube/services/notification/*.yml
    - k8s/minikube/services/payment/*.yml
    - k8s/minikube/services/apikey-manager/*.yml
3. Deploy (strategy, plain kubectl for us):
deploy:
  kubectl: {}
4. Port forwarding (access dashboards from your browser):
portForward:
  - resourceType: service
    resourceName: keycloak
    port: 8080
    localPort: 8180
  - resourceType: service
    resourceName: prometheus
    port: 9090
    localPort: 9090
  - resourceType: service
    resourceName: grafana
    port: 3000
    localPort: 3000
Open http://localhost:8180 for Keycloak or http://localhost:3000 for Grafana, without running kubectl port-forward manually.
Running and cleaning up
Skaffold gives you two modes depending on what you need:
skaffold devis for active development. It builds, deploys, watches for changes, and auto-redeploys. When you hitCtrl+C, it cleans up everything it deployed.skaffold runbuilds and deploys once, then exits. Useful when you just want a stable deployment without file watching. Add--tailto also stream logs.- To tear down a
skaffold rundeployment, runskaffold delete.
At this point, our services are packaged, deployed, and running in a cluster. We can push a code change and see it live in seconds. But here’s the thing: when you have 6 services talking to each other through async messages and REST calls, and something goes wrong… where do you even start looking? A request hits the Order service, which calls Product, which triggers a Payment event, which sends a Notification. If that chain breaks somewhere in the middle, your logs are scattered across 6 different pods.
That’s exactly what we’ll tackle in Part 06: Observability with Distributed Tracing and Metrics.
Resources
- Full guide: miliariadnane.gitbook.io/demo-microservices
- GitHub: github.com/miliariadnane/demo-microservices
Next up: Part 06 - Observability: Distributed Tracing & Metrics.